The Advanced Version of the roadway volume forecasts is now live and can be accessed at https://unifiedplan.org/traffic-volume-map/. This update integrates two modules into the traffic volume map: household/job forecasts and project details from the 2023 transportation plans.
The household and jobs data comes from the Utah Household and Job Forecast Viewer. The project data comes from Utah’s Unified Transportation Plan 2023-2050.
In this blog post, we’ll revisit the features and data offered by these two modules, providing you with a description of their functionality within the traffic volume map.
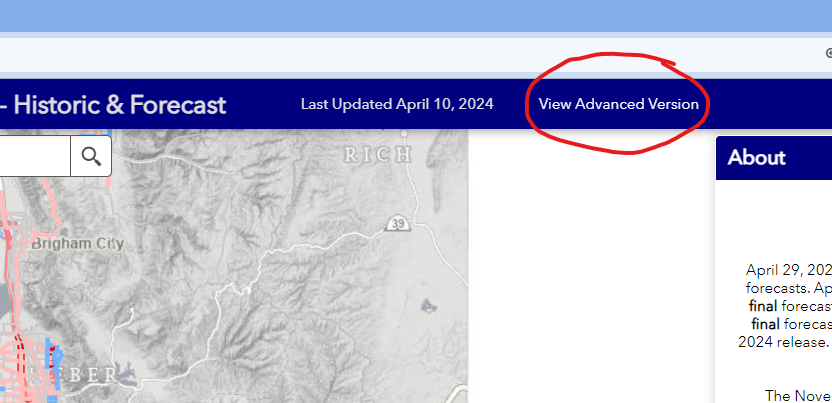
To access the Advanced Version, click on ‘View Advanced Version’ in the top header, as shown here:
After you click, a header above the sidebar will appear that will enable switching to the two modules:
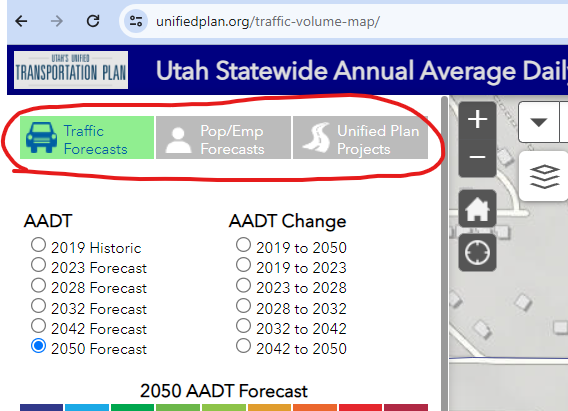
Pop/Emp Forecasts Module
The population and employment forecasts module display a subset of the official forecasts within the app.
|
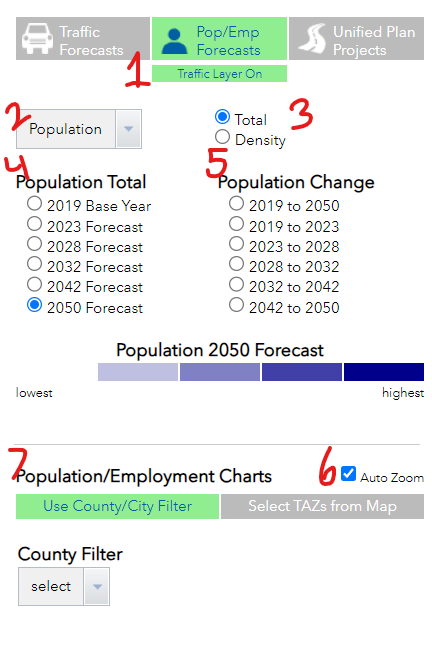
1: Click this button to toggle on and off the traffic volume layer. 2: Click on this drop down to access the attribute you want to display: population, households, typical (total) employment, retail employment, industrial employment, and office employment. 3: Here you can choose between showing the total number of population/employment or the density of population/employment per developable acre. 4: This column of options allows you to choose what single-year forecast you want displayed. 5: This column of options allows you to choose a time range to show the difference between two forecasts for different years. In the map, blue intensity is level of decrease and red intensity is level of increase. 6: Turn off Auto Zoom here, if you want the map to stop moving as you click features or change selections. 7: The population and employment charts are described in the next section. |
Population/Employment Charts - Use County/City Filter
|
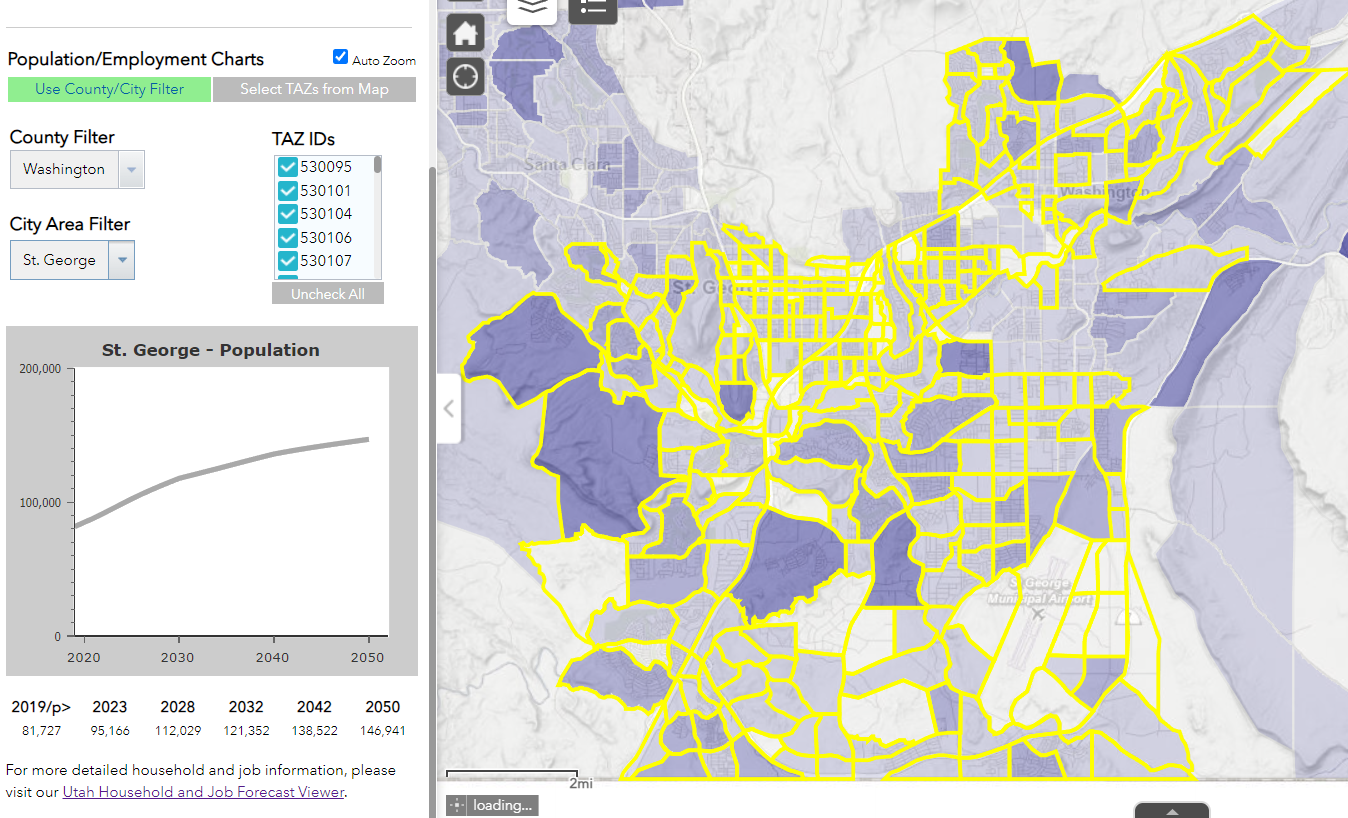
When Use County/City Filter is selected, you can select a County and a City Area to filter the population and employment data. A chart is created that shows trends for the city area, and associated TAZs are also highlighted in yellow in the map. |
|
Population/Employment Charts - Select TAZs from Map
|
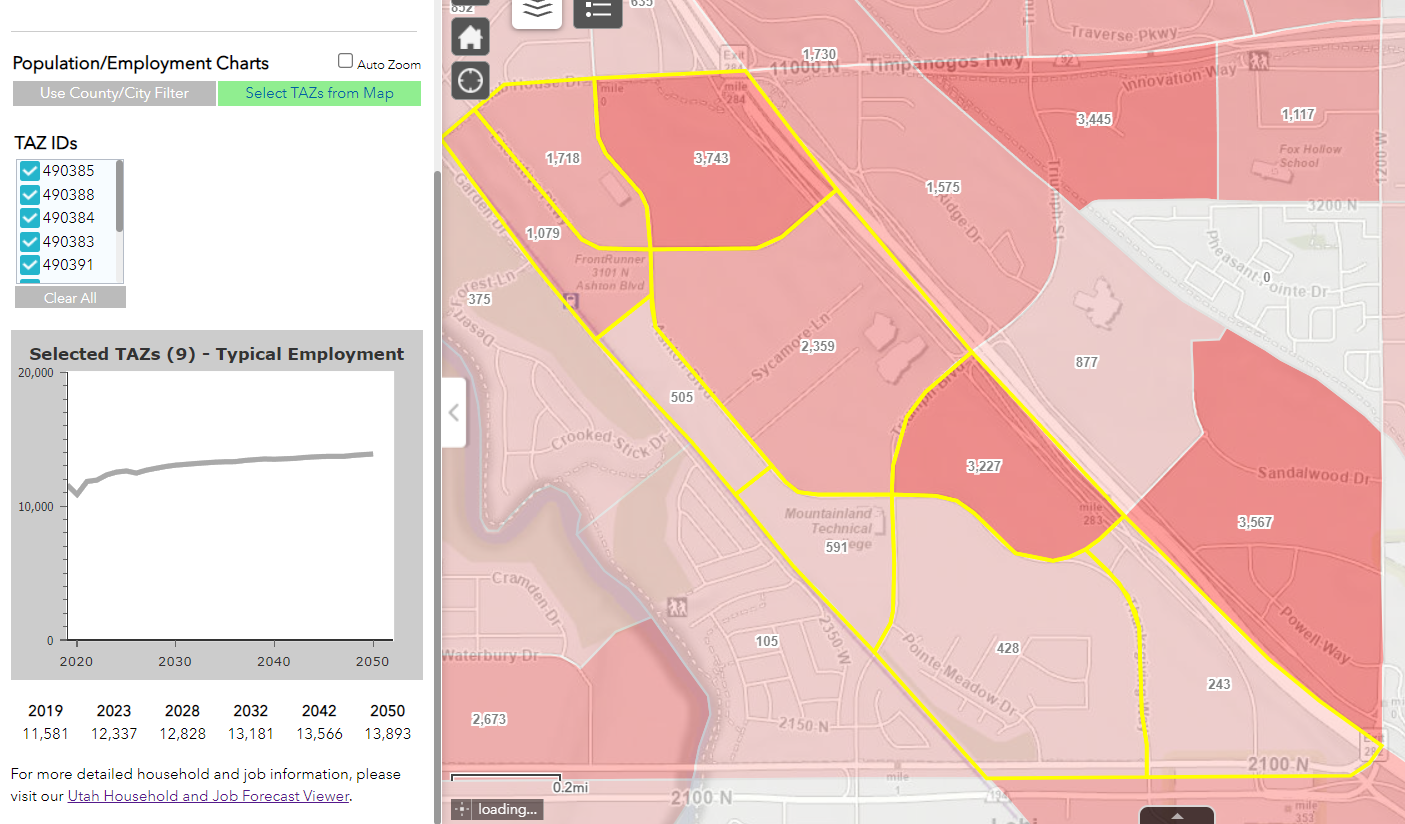
When Select TAZs from Map is selected, you can click on TAZs in the map to filter by your selection. Clicking on a TAZ will add it to the selection, and clicking on it when it's already selected will remove it from the selection. A chart is created that shows trends for the selection. Associated TAZs are also highlighted in yellow in the map. |
|
Unified Plan Projects Module
The Unified Plan projects module display a subset of the official plan within the app.
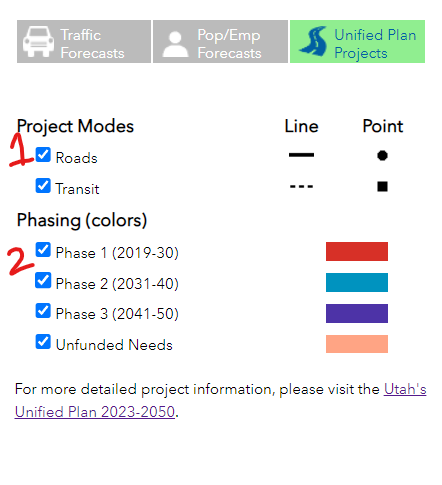
|
1: Check the modes of the projects you want to display on the map. 2: Check the phases you would like displayed on the map. |
Each project in the map is clickable for more detailed information.
